A benchmark comparison measure gives the investor an important tool for measuring the added value, if any, of an actively managed portfolio or a professional money manager.
Investors can do a performance benchmark analysis by examining if the following important measures found in their portfolio performance report prepared by the financial institution. If such a report does not include any of these important measures, chances are there could be some inferior comparison results which the manager intended to hide them from investors. It is then advisable for investors to conduct further due diligence to justify the cost of using such a manager.
Why are benchmark comparison important to investors?
- help select the consistent and value-added money managers for long term investment
- help decide when to change your financial advisors by finding out the non-existence of value-added services
- help evaluate how their portfolios are doing against the benchmarks
- help understand the value of good actively managed portfolios vs. index based funds or ETFs
|
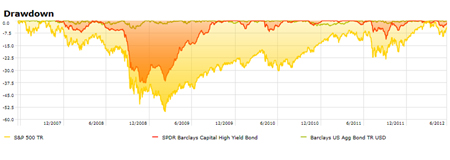
Maximum Drawdown (MDD) is an indicator of the risk of a portfolio chosen based on a certain strategy. It measures the largest single drop from peak to bottom in the value of a portfolio (before a new peak is achieved). MDD offers investors a worst case scenario. It tells the investor how much would have been lost if an investor bought at the absolute peak value of an investment, rode it all the way down, and sold at rock-bottom.
Most investors demand the best preservation of capital from any possible market entry point to achieve a steady performance. MDD is defined as the peak-to-trough decline of an investment during a specific period and is usually quoted as a percentage of the peak value. It can be calculated based on absolute returns, in order to identify strategies that suffer less during market downturns, such as low-volatility strategies. More importantly, the MDD can also be calculated based on returns relative to a benchmark index, for identifying strategies that show steady out-performance over time. MDD Formula MDD (t) = (P – V(t)) ÷ P, for 0 < t < T Where: P: Peak value before largest drop V(t): The value before new high established Note: The absolute MDD can be obtained by selecting lowest V(t) in the MDD(t) formula. To compare MDD for a given portfolio against a relevant benchmark, investors can simply display MDD(t) values for the portfolio and its benchmark on the same chart (see an example shown below). |
|
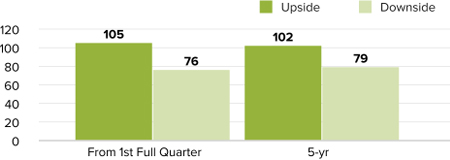
Up/Down Market Capture Ratios show you whether a given portfolio has out-performed or under-performed a relevant market benchmark during periods of market strength and weakness, and if so, by how much.
Up Market Capture Ratio for a portfolio is calculated by taking the portfolio's monthly return during months when the benchmark had a positive return and dividing it by the benchmark return during that same month. Down Market Capture Ratio is calculated by taking the portfolio's monthly return during the periods of negative benchmark performance and dividing it by the benchmark return. Portfolio managers can report the Up/Down Market Capture Ratios by calculating the geometric average for both the portfolio and its benchmark returns during the up and down months, respectively, over a given time period (say, 3-year or 5-year). An Up Market Capture Ratio over 100 indicates a portfolio has generally out-performed its benchmark during periods of positive returns for the benchmark. Meanwhile, a Down Market Capture Ratio of less than 100 indicates that a fund has lost less than its benchmark in periods when the benchmark has been in the red. An example with good up and down capture ratios is show in the chart below. Dividing the down-market into the up-market ratio gives the overall capture ratio, which indicates how a portfolio performs against its benchmark. Up/Down Market Capture Ratio Formula Overall Market Capture Ratio = Up Market Capture Ratio ÷ Down Market Capture Ratio |
|
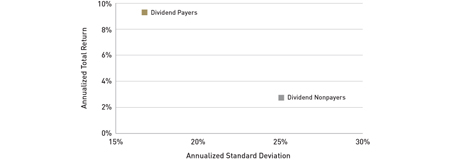
Return (Annualized Total Return) is the geometric average amount of money earned by an investment each year over a given time period. It is calculated as a geometric average to show what an investor would earn over a period of time if the annual return was compounded.
For investors, Volatility is the degree of variation of a portfolio value series over time as measured by the standard deviation of returns. Standard deviation is a measure that is used in descriptive statistics to describe dispersion (also called variability) in a data set. Historic volatility is derived from series of past portfolio values. An easy way to understand way of measuring a portfolio's performance against its benchmark index is simply plot the annualized total return and the standard deviation of returns on the same chart. Sometimes multiple benchmarks may be plotted on the same chart to illustrate the portfolio's returns vs risks compromises (see an example shown below). A simple overall return/volatility ratio can be calculated to compare multiple portfolios and benchmarks at the same time. Return/Volatility Ratio (R/V) Formula R/V = (Annualized Total Return) ÷ (Standard Deviation of the Returns) |
Other Notable Ratios for Equity Evaluation
The most popular measures of portfolio performance for benchmark comparison are list above. There are other measures that could also be indispensable tools for investor's in-depth research process. The benchmark comparison analysis can greatly influence investors' decision to use an actively managed portfolio vs. a passive index fund or an ETF. Other significant methods for benchmark evaluation include
The most popular measures of portfolio performance for benchmark comparison are list above. There are other measures that could also be indispensable tools for investor's in-depth research process. The benchmark comparison analysis can greatly influence investors' decision to use an actively managed portfolio vs. a passive index fund or an ETF. Other significant methods for benchmark evaluation include
- Alpha is the excess return of the portfolio over its benchmark. More specifically, it measures the excess return of a portfolio over its required return, or its expected return, for its expected risk as measured by its Beta. Alpha is determined by the fundamental values of the companies in the portfolio. Note that it is necessary to identify the portfolio’s relevant benchmark. R-Squared (from 0 to 100, referred to as “the goodness of fit") is calculated first. If the R-Squared is closer to 100, the portfolio is relevant to its benchmark and then Alpha numbers are more reliable. Higher Alphas are more desirable. If the Alpha is negative, then the portfolio is under-performing the benchmark.
- Information Ratio (IR) is the statistic computed by subtracting the return of the market from the return of the portfolio manager to determine the excess return. The excess return is then divided by the standard deviation of the excess returns (Tracking Error). IR is a measure of the value added per unit of active risk by a portfolio manager over a comparing benchmark. The higher the information ratio, the better. If the information ratio is less than zero, it means the active manager failed on the objective of outperforming the benchmark. IR stands as a great way to justify an active manager’s value existence.
- Excess Returns Relative to Its Benchmark is an easy to understand bar chart which simply shows the differences between an portfolio's return and its benchmark's return over time. The time period shown can be monthly, quarterly, or annually. A given total time period can also be used as the basis for comparison, such as Last Quarter, Year to Date, 1 Year, 3 Years, 5 Years, 10 Years, and Since Inception Date.


